Wildfire risk to highly valued resources such as carbon is based on three factors: likelihood of fire, intensity of fire, and susceptibility of the resource to fire. Understanding how these factors affect your area of interest can help with planning and selecting management activities that can reduce risk.
Wildfire risk is calculated from the likelihood of fire of various intensities and the susceptibility of the carbon in the vegetation to fire.
Wildfire likelihood, also called burn probability, is the chance that a wildfire will burn a specific location. For example, a place might have a 1-in-25 chance (or probability) of burning in any given year.
In the datasets shown here, wildfire likelihood is based on simulations of individual fires during many thousands of possible fire seasons using FSim, the Large Fire Simulator. Factors that influence the likelihood of burning include weather conditions, topography, vegetation/fuels, and ignitions. In each simulation year, weather and ignitions vary based on patterns derived from observations in recent decades. Wildfire likelihood is not predictive in the sense that it can’t tell us the exact location or timing of future wildfires, but rather where they are more likely to occur under current conditions. Instead of reflecting currently forecasted weather or fire danger conditions in a particular year, wildfire likelihood derives from the topography, vegetation/fuels, and potential weather that affect a place from year to year.
Wildfire likelihood can be difficult to modify, but wildfire prevention, response, and fuel treatments are steps a landowner can take to reduce likelihood. In some cases, wildfire can also represent an ecological benefit depending on the conditions and timing of the burn.
Intensity is a measure of the energy a wildfire emits while burning. A useful analogue for intensity is flame length: a fire with higher flame lengths is more intense, while a fire with lower flame lengths is less intense.
Intensity varies based on the type of vegetation and fuels and their amounts, how dry they are, the topography of a place, the weather, and the direction a fire is traveling across the landscape (for example, a fire heading up a slope will be more intense than one backing down). A fire traveling uphill through the crowns of the trees in a forest will be more intense than one traveling through grasses on flat ground. Wildfire intensity is technically measured in units of heat transfer per length of fire perimeters, but it is more easily observed and expressed in terms of flame length.
The likelihood of fires of various intensities is also estimated using the fire simulations described above in the Wildfire Likelihood section. For each fire that is simulated, metrics of wildfire behavior including intensity are recorded.
Susceptibility refers to how much carbon is lost and how many trees are killed by fires of various intensities. Wildfire Risk to Carbon estimates these factors using simulation modeling in the Forest Vegetation Simulator based on scientific studies of tree mortality and consumption of litter, duff, woody debris, branches, and leaves during wildfires. In order to make maps of susceptibility, the TreeMap and FuelMap datasets are used. TreeMap uses machine learning to match tree data measured on forest plots throughout the continental U.S. by the Forest Service’s Forest Inventory and Analysis program to gridded maps of forest characteristics, topography, and climate. The result in TreeMap is a tree-level model of the forests of the continental U.S. Similarly, FuelMap uses machine learning to match fuel data (litter, duff, and woody debris) measured on forest plots to gridded maps.
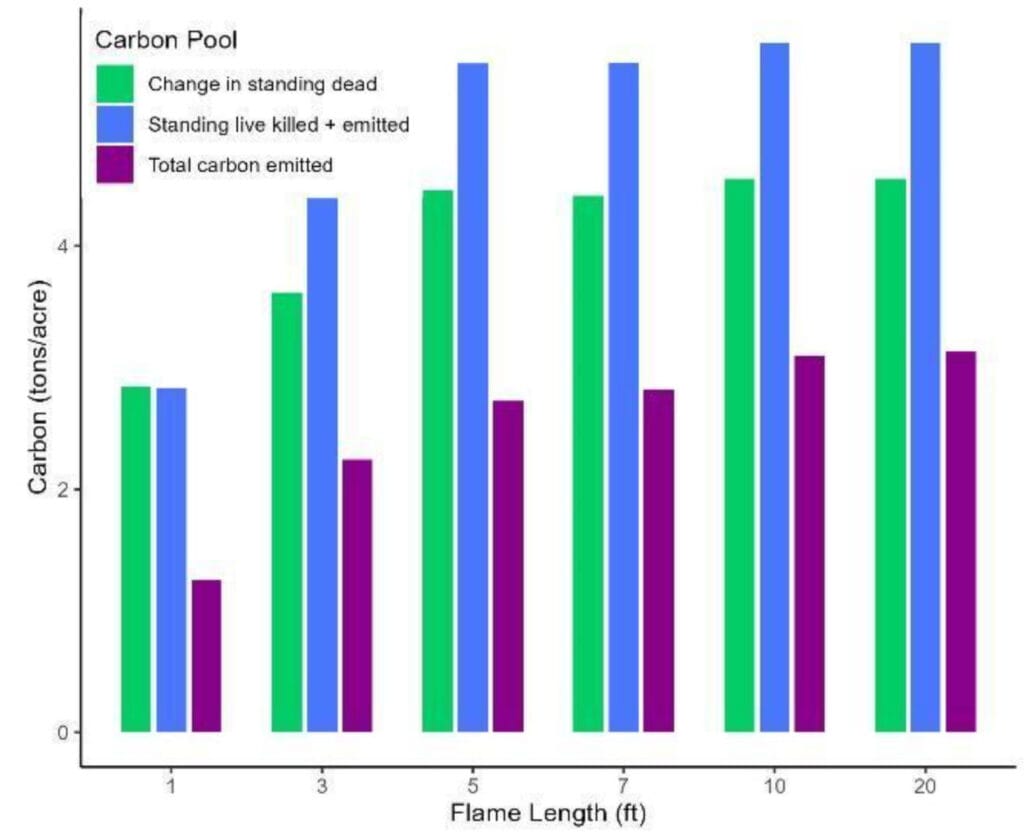
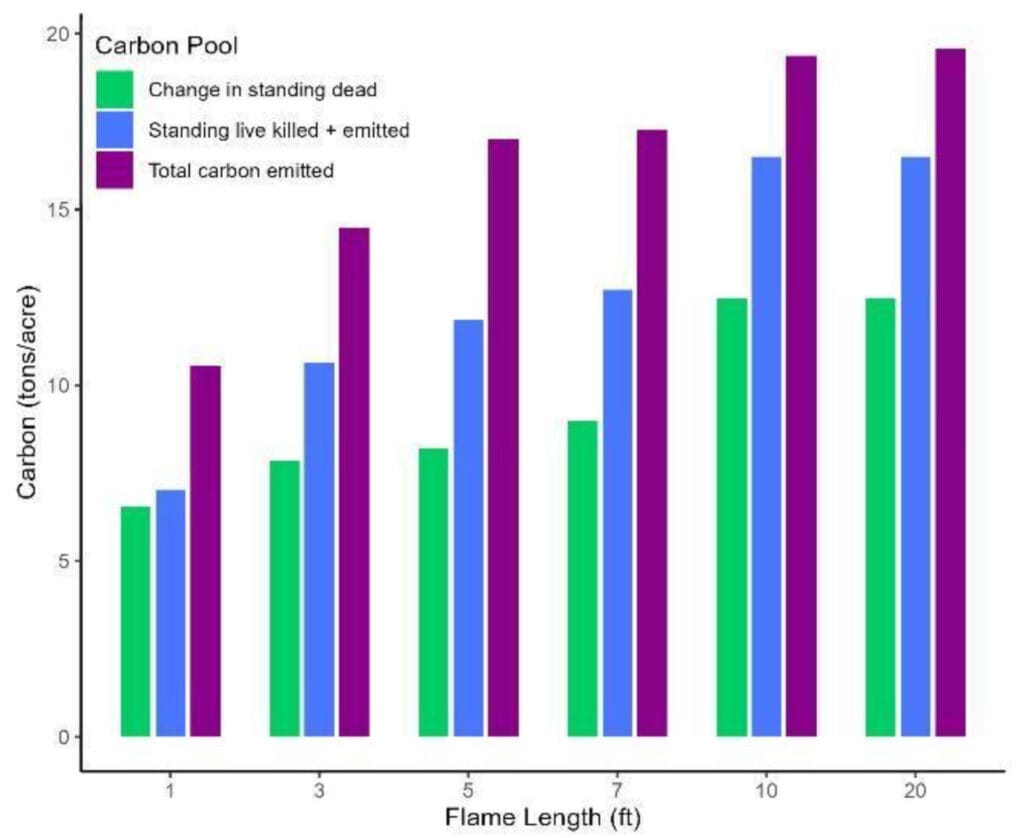
These graphs offer two of many possible scenarios about what happens to forest carbon during a fire by looking at fire effects in two different forested stands. The horizontal axis shows the flame length or intensity of the simulated fire, while the vertical axis shows the amount of carbon affected by the fire. The amount of carbon affected by the fire increases with the flame length or intensity. In other words, more carbon is turned into smoke and more trees are killed as the fire intensity increases. In the stand at left, the primary change in carbon is the shift of carbon from live trees to dead trees. Immediate emissions from the wildfire would account for less carbon loss than the slow loss from the trees killed in the fire as they decay over time. By spreading out the loss across time, carbon can continue to be stored while the stand regenerates. In the stand at right, however, the immediate emissions from the wildfire are greater than the slow loss from fire-caused tree mortality. This is due to larger amounts of carbon in the forest floor pools in this stand; these include litter (needles and leaves dropped by the trees), duff (decomposing needles and leaves), and woody debris (such as logs). Explore Susceptibility
An area’s susceptibility can be reduced by fuel treatment, prescribed fire, and managed fires (such as the Pinal Fire)
Management actions that are not specifically designated as fuel treatments, but that encourage the establishment of fire-resistant tree species and the growth of larger trees can also impact susceptibility. Many of these activities require maintenance over time to impact susceptibility when a wildfire occurs.